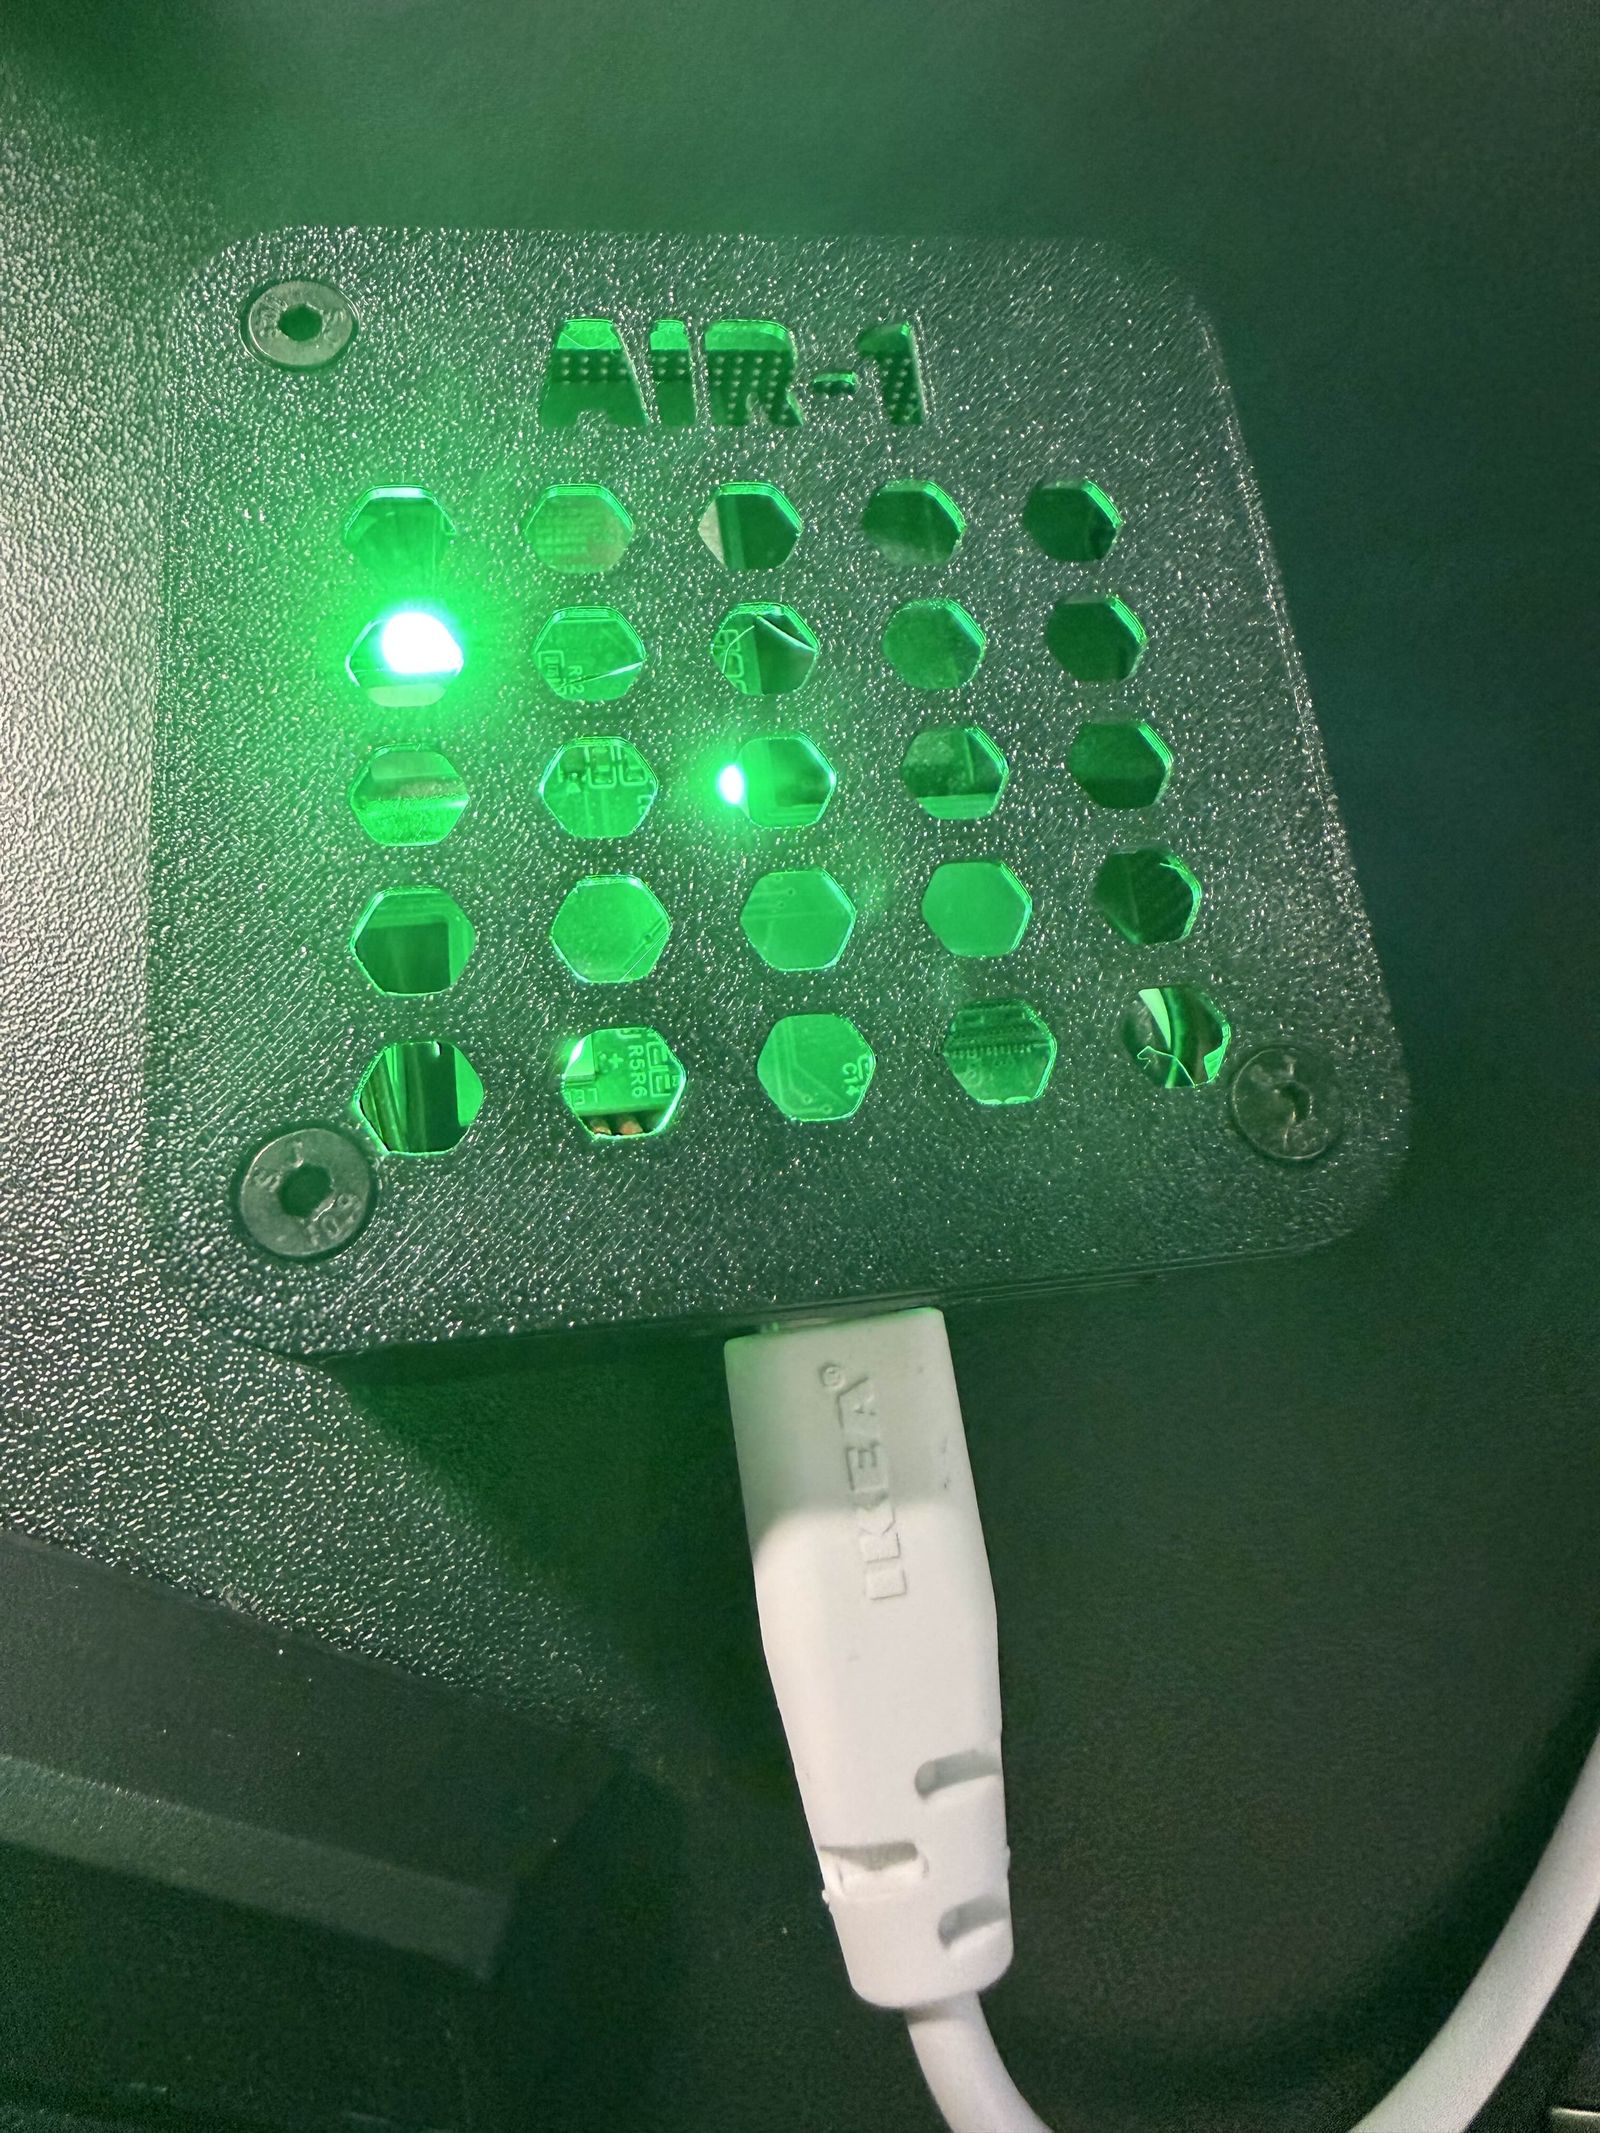
Disclosure: I work for Apollo Automation. The AIR-1 is one of our devices and this is firmware I work on.
The AIR-1 has three onboard RGB LEDs. I wanted them to show air quality at a glance, green when the air is good and red when it isn’t, driven by the device’s own readings. NowCast AQI, CO2, or the VOC index, your pick. It’s a small feature. Getting there took way longer than it should have, mostly because I kept fixing things that weren’t the problem. I built it with Claude Code, so a lot of these wrong turns are its, but I was the one watching it happen. These are the dead ends, in order.
The crash I chased the wrong way
The first working version booted straight into a crash loop. The log said store access fault in the LED code, down in AddressableLight::schedule_show. I’d just added a small thing to on_boot to kick the LEDs at startup, so that got the blame. We moved it to a later boot priority. Still crashed. Moved it again. Deleted it entirely. Still crashed.
The real cause was in the backtrace the whole time. The crash came from the source dropdown, not the boot code. The dropdown restores its saved value when the device starts, and restoring it fired the LED update before the light hardware was set up. Writing to a light that doesn’t exist yet faults. The fix was one line: skip the LED update for the first few seconds after boot. The hard part was getting myself to stop staring at the code I’d just touched and read what the crash was telling me.
The fixes weren’t even reaching the device
Part of why it kept crashing the exact same way: the fixes weren’t getting flashed. Every crash pointed at the same line, Core.yaml:713, and that line didn’t match the code I had open anymore. ESPHome’s builder had cached a copy of the package and kept compiling that one, no matter what I pushed. Setting refresh: 0s didn’t help. What finally fixed it was resetting the build environment so it re-downloaded everything fresh and compiled from scratch. Once it did that, the line numbers matched and my code was running. It took an embarrassing number of identical crashes before I thought to check the device wasn’t even running what I’d pushed.
The 10-second loop was the wrong design
I started out adding this as an overlay, using ESPHome’s !extend to bolt onto the existing config without forking the firmware. That mostly worked, but !extend can’t reach the readings I needed (CO2 and VOC are nested inside their parent sensors), so I fell back to polling everything on a 10-second timer.
Then we forked the repo and edited the firmware directly. That removed the whole reason for the timer, since I could now react to each sensor the moment it updated. But Claude Code kept reaching for the !extend and timer approach long after we’d stopped using overlays, even though editing the file directly made it pointless. Once I caught that, the timer came out and the LED went event-driven, updating exactly when the selected reading changes. That also killed a dumb side effect of the timer, where “Off” was turning the LED off every 10 seconds and would have fought anyone trying to use that light themselves.
For the ESPHome folks: this is a spot where an !override tag, sitting alongside the existing !extend and !remove, would have let me change a nested sensor straight from an overlay and skip the fork entirely.
The CO2 nudge that did nothing
At one point I tried to force an early CO2 reading at boot so a CO2-colored LED would light up faster. It did nothing useful, because the SCD40 has no reading ready a second or two into boot, so the nudge was a no-op. But it was the wrong idea even if it had worked. The SCD40 needs time to settle before its numbers are accurate, so an early reading just means lighting the LED with a value the sensor doesn’t trust yet. The right move was to do nothing and let the sensor report on its normal schedule. The first CO2 color shows up about a minute after boot, and that minute is the sensor settling, which is exactly what you want.
What it does now
The feature is small and off by default. There’s an Air Quality LED Source dropdown with Off, NowCast AQI, CO2, and VOC Index. Pick one and the LEDs map that reading onto six colors, green for good through deep red for hazardous, each on the scale that fits the metric:
| Color | NowCast AQI | CO₂ (ppm) | VOC Index | Meaning |
|---|---|---|---|---|
| 🟢 Green | 0 to 50 | up to 800 | 0 to 79 | Good |
| 🟡 Yellow | 51 to 100 | 801 to 1000 | 80 to 149 | Moderate |
| 🟠 Orange | 101 to 150 | 1001 to 1500 | 150 to 249 | Unhealthy for sensitive groups |
| 🔴 Red | 151 to 200 | 1501 to 2000 | 250 to 399 | Unhealthy |
| 🟣 Purple | 201 to 300 | 2001 to 2500 | 400+ | Very unhealthy |
| 🟤 Maroon | 301+ | 2501+ | n/a | Hazardous |
There’s an Air Quality LED Brightness slider too, 5 to 100 percent, because three LEDs at full brightness are a lot in a dark room.
Since it’s event-driven now, the color updates the moment the selected sensor reports. Set it to Off and the firmware leaves the light alone, so you can still use it for your own automations. It stays out of the way of the device’s startup and status flashes too. The whole thing lives in one file, so the normal AIR-1, the Bluetooth proxy build, and the factory build all pick it up.
It’s in beta now.
What the three readings are
NowCast AQI comes from ESPHome’s aqi component, which turns the PM2.5 and PM10 particulate readings into the EPA’s air quality number. CO2 is carbon dioxide, which climbs as a closed-up room gets stuffy and is a decent stand-in for how badly a space needs fresh air.
The VOC index works differently. It’s Sensirion’s gas index, built to behave like a human nose. 100 is the running average of what your air normally is, and the number climbs when something new shows up, cooking, cleaning, a fresh can of paint. It reads relative to your own space, not as an absolute level, so the same room of “normal” air sits around 100 whether you keep a tidy studio or a workshop full of solvents.
That same Sensirion note suggests showing the index as a traffic light without numbers, colored by level, so people can see a gas event without reading a chart. Which is more or less exactly what these three LEDs do.