Disclosure: I work for Apollo Automation. The AIR-1 sensors throughout this post are ours.
I spent two days on the ceiling in the upstairs bathroom. Cutting out a damaged section of sheetrock, disturbing the old insulation behind it, and scraping off some of the popcorn texture. The usual mess, spread across yesterday and today.
The bathroom itself has no air sensor. But the rest of the house is covered in them. I have an Apollo AIR-1 in eight rooms, each reporting PM2.5 into Home Assistant every minute or two. So without planning to, I ran the same experiment twice: tear into a ceiling and watch what every particle counter in the house does at the same moment.
A few things were running that shaped the result. I kept the central HVAC off while I was actually cutting and flipped it back on during breaks. A portable AC ran in the cat room and another in the guest bedroom. And I had a Honeywell air purifier going on turbo in the upstairs living room, the room right off the bathroom. Keep that purifier in mind, because it makes the numbers there more impressive, not less.
The two days didn’t match, and the difference is the interesting part.
Day one: one room spiked
For most of the morning the upstairs living room, the room the bathroom opens directly onto, sat around 3 µg/m³ of PM2.5. Quiet, normal indoor air.
Then at 12:08 it hit 22.
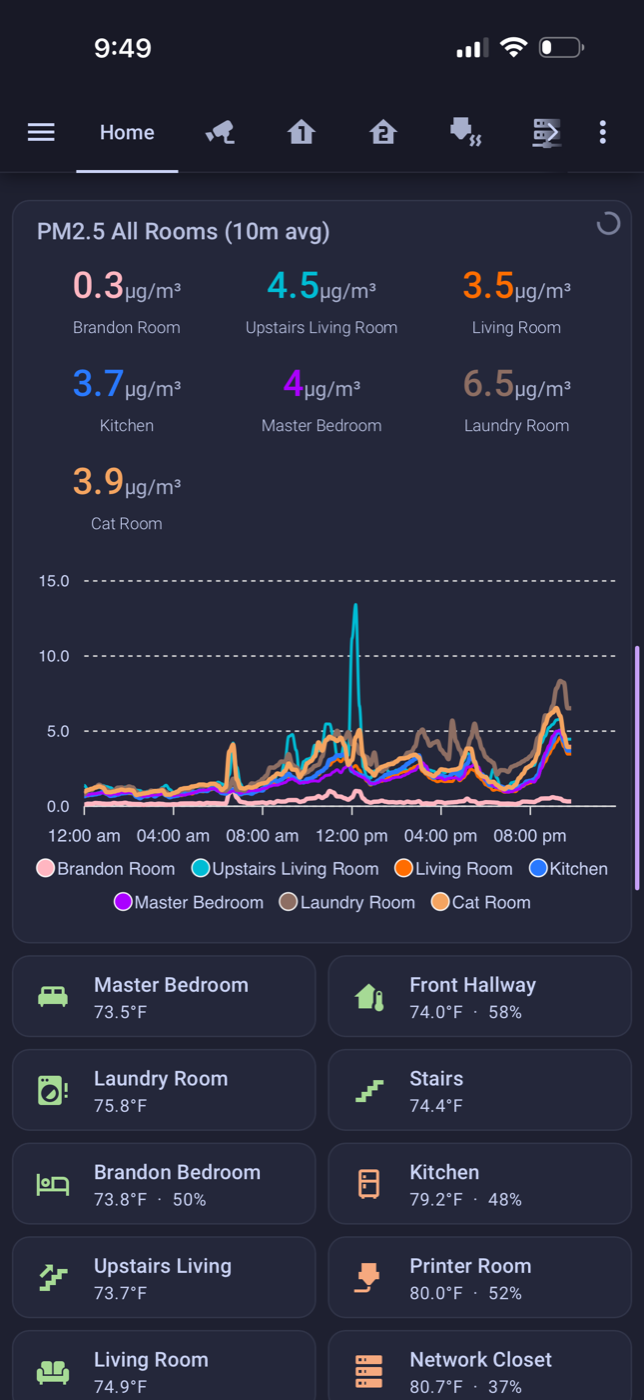
That teal spike is the sheetrock dust, old insulation, and popcorn texture going airborne the moment I started cutting and scraping. The dashboard card above averages over ten minutes, so it shows the peak as roughly 13. The raw sensor caught the real number: a jump from 1 to 22 in a few minutes. And it did that with the Honeywell purifier running on turbo three feet away. I was making dust faster than a dedicated air scrubber could pull it down.
The surprise was the cat room. It also shares a doorway with the bathroom, and it barely moved, peaking at 4.9, right in line with rooms on the far side of the house. The reason is sitting in that room: a portable AC that pulls in fresh outside air and cools the space. It was actively diluting the room and pushing air outward, so on day one the dust funneled toward the upstairs living room and the cat room’s own ventilation held it off.
Day two: both rooms got it
Today I worked the same ceiling, and the dust didn’t behave the same way.
This time both rooms that open onto the bathroom spiked, and spiked hard. The upstairs living room hit 30.9 and the cat room hit 29.4, within a minute of each other. The room the AC kept clean yesterday took almost the full dose today, fresh air intake and all. There was simply more dust in the air than that little unit could flush out.
And it spilled further. The cat room connects to Brandon’s room, so Brandon’s room, which sat at 1.6 the day before and never feels the bathroom directly, ticked up to 4.0. You can watch the dust hand off from one room to the next.
Nothing changed about the bathroom. What changed was how much dust I made and whether the cat room’s ventilation could keep up. Distance from the work barely mattered. Airflow, both the doors and that AC, decided everything.
Both days, every room, side by side
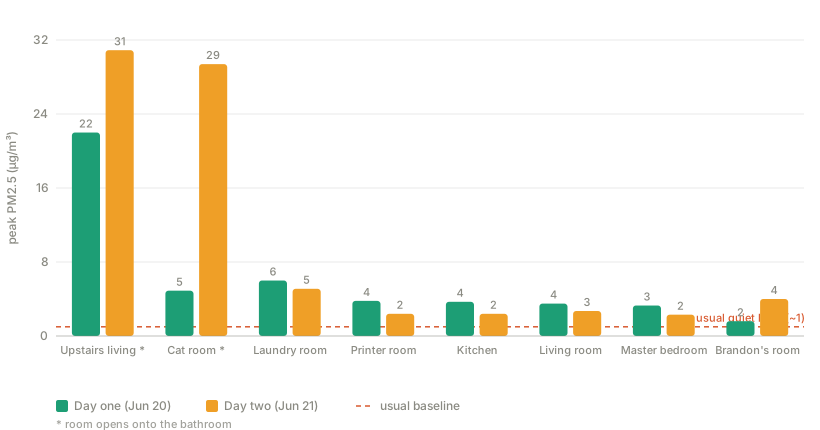
Here’s each room’s peak PM2.5 on both days, against the level it normally sits at. The bathroom opens onto two rooms, the upstairs living room and the cat room. Everything else is elsewhere in the house, including the entire downstairs.
| Room | Usual (quiet) | Day one peak | Day two peak |
|---|---|---|---|
| Upstairs living room (opens to bathroom) | 1.0 | 22.0 | 30.9 |
| Cat room (opens to bathroom) | 0.9 | 4.9 | 29.4 |
| Laundry room | 1.1 | 6.0 | 5.1 |
| Printer room | 0.8 | 3.8 | 2.4 |
| Kitchen | 0.7 | 3.7 | 2.4 |
| Living room (downstairs) | 0.7 | 3.5 | 2.7 |
| Master bedroom (downstairs) | 0.7 | 3.3 | 2.3 |
| Brandon’s room | 0.2 | 1.6 | 4.0 |
All numbers are µg/m³ of PM2.5. The “usual” column is the overnight quiet level, when nothing is going on.
This is the part I got wrong when I first looked at the data. The two rooms off the bathroom obviously dominate, peaking 20 to 30 times over their baseline, and it’s tempting to call everything else flat by comparison. But it isn’t flat. Every room in this house normally sits below 1 µg/m³. During the work the downstairs living room, kitchen, and master bedroom all ran three to five times that, and Brandon’s room went from basically zero to 4. Nothing held at its quiet level. The dust didn’t stay upstairs. It just spread at two very different scales.
It was coarse dust, and PM2.5 undersold it
Everything above is PM2.5, particles under 2.5 micrometers. But the AIR-1 reports four sizes: PM1, PM2.5, PM4, and PM10. Up to here I’ve been quoting only one of them, and for this kind of work that undersells what actually happened.
Here’s the upstairs living room at each day’s peak, broken out by particle size.
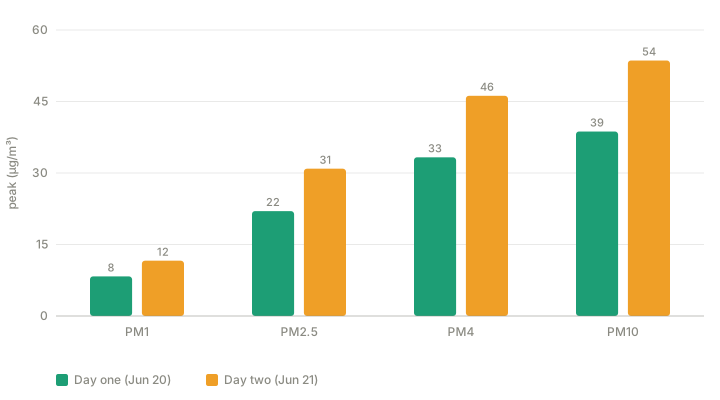
The mass climbs the whole way up. On day two PM2.5 peaked at 31, but PM10 peaked at 54, nearly double. The dust is mostly in the coarse fraction, the 2.5 to 10 micrometer range, and reading only PM2.5 hid about 40 percent of it.
That distribution is the signature of mechanical dust. Cutting drywall and scraping a ceiling shears off relatively large, heavy particles. Smoke and cooking are the opposite, almost all of their mass sits below 1 micrometer. So the shape of these bars, small at PM1 and large at PM10, is itself the proof that this was construction debris and not something burning. It also explains how the dust behaved once it left the room, which is the next piece.
The return air spread it everywhere
The reason the whole house lifted is the HVAC. It’s one system, and there’s a return register in every room.
A central system doesn’t just blow conditioned air out. It pulls room air back in through those returns, mixes it at the air handler, and pushes it out to every room. I kept the main system off while I was actively cutting, which helped, but I turned it back on during breaks. Every time it ran, it had a return sitting right there in the work zone, sipping up the dust I’d just made and pushing it through the supply ducts to all eight rooms at once.
That’s where the particle sizes pay off. The coarse fraction, the PM4 and PM10 that made up most of the mass, is heavy. It settled near the source within minutes. The fine fraction, the PM1 and the lighter PM2.5, stays airborne long enough to ride the return-air loop, and that’s what reached the far rooms. The house didn’t get a uniform dose. The rooms next to the work got hit directly across every size, and everywhere else got a thin, ducted version made mostly of the finest particles.
Both spikes still cleared fast. By tonight every room is back under 1. A cloud like that settles and ventilates out within an hour once you stop making it, faster in the rooms with a portable AC or the purifier running, and the same return-air mixing that spread it also helped flush it once the source was gone.
What the sensors are actually showing
Those peaks are fine debris from the work: gypsum dust from the sheetrock, fibers shaken loose from the old insulation, and bits of the popcorn texture I scraped down. The AIR-1 measures particle mass at four sizes, and tearing into an old ceiling throws off a lot of it across all of them.
Here’s the important caveat, and it’s the whole reason for the next section. A PM sensor does not detect asbestos. Asbestos fibers are long, thin, and light, and they don’t register the way a clump of drywall dust does. So a clean-looking PM2.5 chart tells you the room cleared of visible dust. It tells you nothing about fibers. Don’t read “back to baseline” as “safe to breathe.” Those are two different questions.
Why I wore a P100
This house is old enough that the popcorn ceilings might contain asbestos, and popcorn texture is exactly where it tends to hide. I haven’t had it tested, which means I treat it as if it does until a lab says otherwise. That’s the safe assumption for any textured ceiling in a home built before the 1980s.
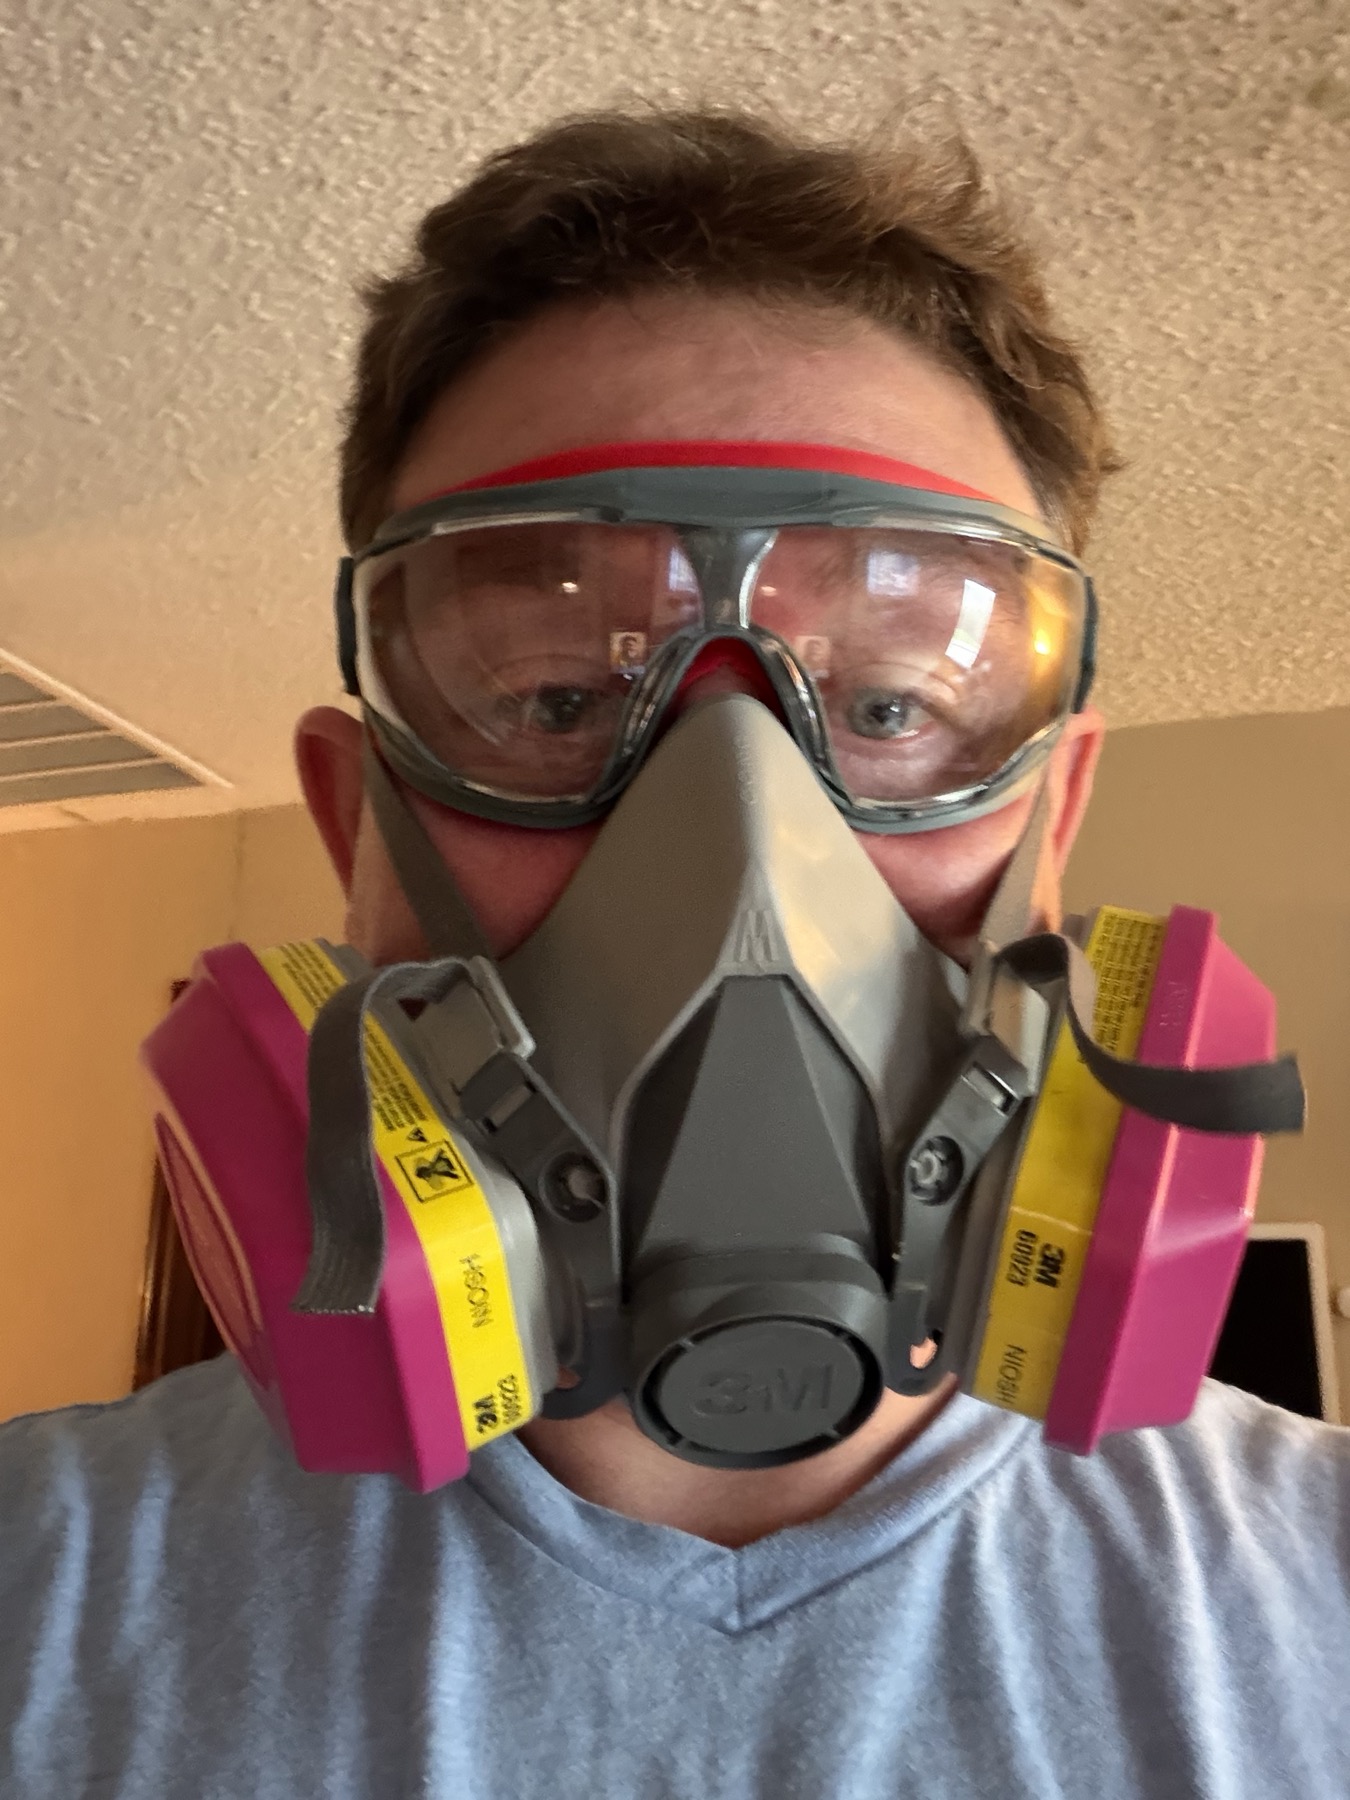
Asbestos is only dangerous when it’s disturbed and the fibers go airborne, which is precisely what scraping popcorn ceiling and cutting into old sheetrock does. So for both days I wore:
- A 3M half mask respirator with P100 cartridges. The pink ones. P100 filters 99.97 percent of airborne particles and is the right rating for this. A paper dust mask is not.
- Sealed goggles, so nothing gets in around the eyes.
- Gloves.
If you’re doing the same kind of work, three things matter more than anything I measured.
First, if there’s any chance your ceiling has asbestos, get a sample tested before you disturb it. A lab test is cheap compared to the alternative. If it comes back positive, that’s a job for a licensed abatement pro, not a weekend project.
Second, kill the HVAC and cover the returns. The data above is the argument: a return register in the work zone turns your whole duct system into a distribution network for whatever you just put in the air. Worse, ducts store dust, so a return that inhales drywall dust today can keep dribbling it back out for days. If the ceiling might be asbestos, that’s not dust you want living in your ductwork. I shut the main system off while cutting, which was right. Taping plastic over the nearby returns would have been better.
Third, the sensors aren’t your safety gear. They’re a nice way to see what happened after the fact, and a good reminder of how far dust travels from where you make it. The P100, the goggles, killing the HVAC, and not disturbing asbestos are what actually protect you.
The takeaway
I like that the sensors caught both days. The two rooms off the bathroom spiked 20 to 30 times over while every other room, including the whole downstairs, quietly tripled off the back of the return air. That’s how dust actually moves through a house: a heavy dose at the source, and a thin ducted dose everywhere the HVAC reaches. There’s no truly clean room when the system is running.
But the data isn’t the protection. Wear the respirator. Kill the HVAC and cover the returns. Assume the popcorn ceiling is asbestos until a test says it isn’t. Let the house air out. Then go look at the graphs.